


Three weeks. That is roughly how much summer many districts have left before the parking lots fill back up and the first bell rings on a brand new year. It is the kind of stretch that always feels longer in June and shorter in August, and right about now, transportation coordinators and administrators everywhere are feeling that squeeze.
The good news is that the last few weeks of summer are exactly the right amount of time to get ahead of the year, provided the data behind bus routes, school zones, and safety plans is ready to work as hard as everyone else will be come the first week of September.
Bus routing, school zone boundaries, and safety mapping all depend on GIS, whether anyone in the front office thinks of it that way or not. Getting these pieces right before the first bell rings saves weeks of headaches later.
Bus Routes Built on Real Data, Not Last Year’s Guess

Every district reroutes buses to some degree each year. Students move, new subdivisions get built, and roads close for construction that nobody flagged in June. The districts that handle this well are the ones treating routing as a live data problem rather than an annual copy-paste exercise.
With current parcel and address data layered against road networks, transportation coordinators can see exactly where students live relative to stops, spot overlapping routes that waste fuel and time, and catch the new cul-de-sac that got added to a subdivision but never made it onto anyone’s map. A route that looked efficient on paper last spring can become a fifteen-minute detour once a road closes for repaving, and GIS is what catches that before the first day of school rather than during it.
There is also a safety layer here that matters as much as efficiency. Stop locations placed along busy roads or blind curves create real risk, and a map that shows sight lines and traffic patterns alongside stop points gives transportation staff a much clearer basis for those decisions than institutional memory alone.
School Zone Boundaries That Actually Hold Up
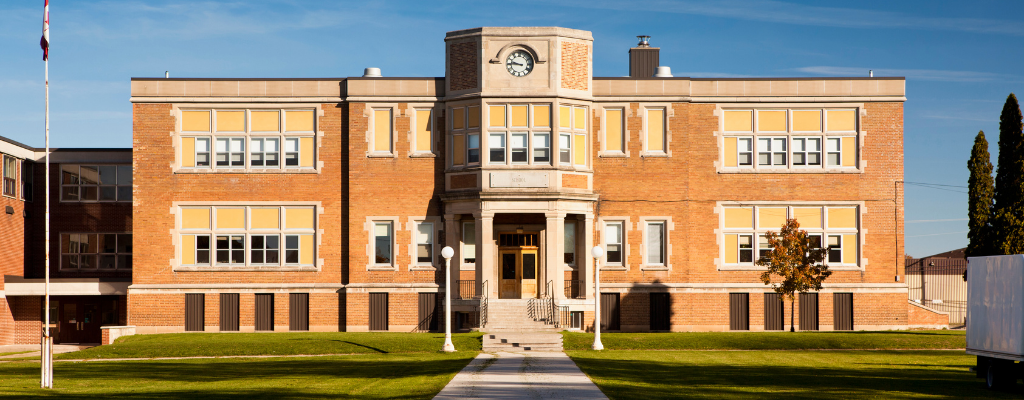
Few things frustrate a parent faster than being told their child no longer qualifies for a school they have attended for years, especially when the reason is a boundary line nobody can quite explain. Zone boundaries drawn without accurate, current parcel data tend to drift out of sync with reality, catching new developments in the wrong district or splitting a single street between two schools in a way that makes no logistical sense.
Mapping these boundaries against live parcel and enrollment data lets administrators see capacity pressure building in specific neighborhoods well before it becomes a crisis. If one elementary school is approaching capacity while another two miles away has open seats, that pattern shows up clearly on a map long before it shows up in a strained cafeteria. Districts making rezoning decisions with that visibility tend to face far less pushback than those adjusting lines reactively each spring.
Safety Mapping for the Moments Nobody Wants to Plan For
The most important use of GIS in a school setting rarely comes up in casual conversation, and that is exactly the point. Emergency access points, building layouts, and evacuation routes only matter in the moment when something has gone wrong, which is precisely why they need to be mapped and ready well before that moment arrives.
Layering building floor plans, entry points, and nearby hydrant or utility shutoff locations into a shared GIS platform gives first responders a head start they would not otherwise have. A responder who can see a building’s layout before arriving on scene moves with a level of confidence that a paper binder in a front office simply cannot provide. For districts that share these layers with local law enforcement and fire departments ahead of the school year, that coordination becomes second nature rather than something pieced together during an actual emergency.
Getting Ahead of the First Bell

None of this requires a complete overhaul of how a district manages its data. It requires current information, clear ownership of that information, and a system flexible enough to update as enrollment shifts, roads change, and new developments appear on the map.
For districts, counties, and the transportation departments that support them, the last few weeks before school starts are the right time to check whether routing data, zone boundaries, and safety maps reflect this year’s reality rather than last year’s assumptions. A short review now, while the buses are still parked and the halls are still empty, tends to save far more time than any fix attempted once the year is already underway.
If your district’s GIS could use a closer look before the semester starts, we offer a free ninety-day iGIS® demo built around your own data, so your team can see exactly how it holds up before committing to anything.
Halfway Through 2026: A Look Back at the Stories We’ve Told So Far