
Redistricting Is Happening in Virginia. Here’s How GIS Keeps Counties Ready.
Every decade, after the Census Bureau releases updated population figures, states redraw the boundaries that determine which citizens are represented by which elected officials — from local school boards all the way to the U.S. House of Representatives. The goal, at least in principle, is equal representation. Districts must have equal population to comply with the U.S. Supreme Court’s “one man, one vote” rulings, and must reflect race and ethnic diversity to comply with the Voting Rights Act of 1965. Simple enough on paper. In practice, redistricting is one of the most politically charged exercises in American government.
That’s because whoever controls the map controls a great deal of political power — and both parties know it.
What’s Happening Right Now in Virginia
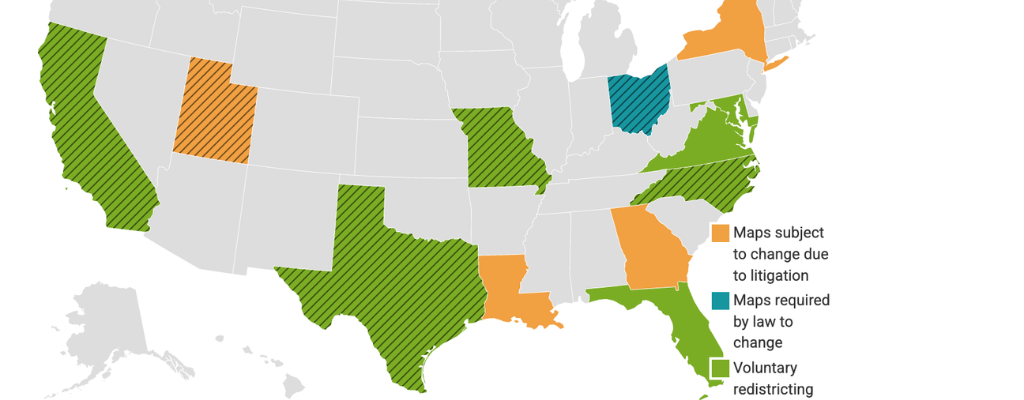
Virginia is in the middle of something historically unusual. Before 2025, only two states had conducted voluntary mid-decade redistricting since 1970. Virginia is now part of a much larger national wave. Although the state had already adopted new congressional and legislative maps following the 2020 census, political pressures and shifting partisan incentives pushed lawmakers to undertake an unprecedented attempt at mid-decade redistricting.
In October 2025, the Virginia General Assembly adopted a resolution allowing the legislature to consider a constitutional amendment for mid-decade redistricting. The House of Delegates voted 51-42 along party lines to approve it, followed by the Virginia Senate at 21-16. Ballotpedia The amendment passed a second time in January 2026 — required under Virginia’s constitution — and a statewide referendum is now scheduled for April 21, though it continues to face legal challenges. VPAP
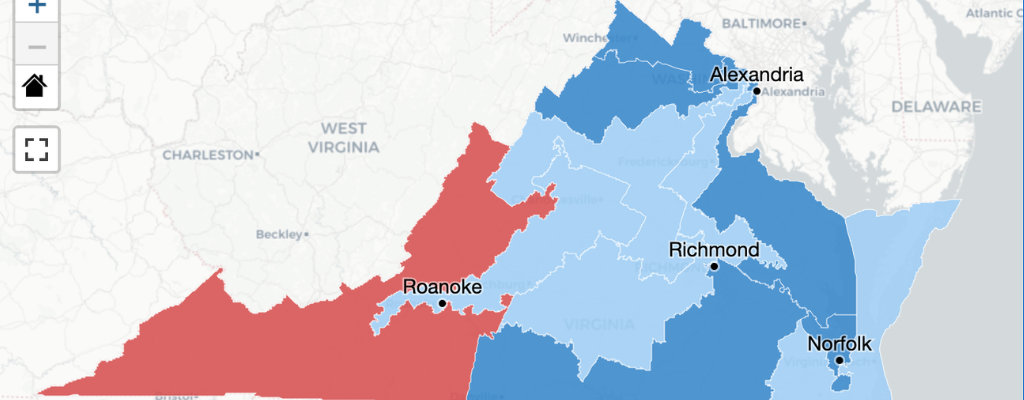
The proposed maps, if approved, would significantly shift congressional representation. Virginia Democrats’ proposed map would produce 10 Democratic and 1 Republican congressional district out of the state’s 11 total seats and shift 48% of Virginia’s population to a new district. Virginia Mercury
Whether you support it or oppose it, the mechanics of redistricting — drawing, analyzing, and communicating new boundaries — are a GIS problem. And that’s where local governments need to be prepared.
The Case For and Against Mid-Decade Redistricting
Supporters argue that when other states redraw their maps for partisan advantage, states that don’t respond are left at a structural disadvantage in Congress. Fairness, they say, requires a level playing field. Critics counter that disrupting maps outside the normal decennial cycle undermines the independent redistricting commissions voters supported and invites escalating retaliation. Virginia’s existing congressional maps were drawn under a voter-approved mandate for bipartisan redistricting and were described by the bipartisan mapmakers as balanced and not unduly favoring either party. Virginia Mercury
There’s also the practical burden that rarely gets discussed: counties, cities, and towns have to actually implement whatever map comes out of this process — updating precinct boundaries, notifying voters, realigning service areas, and communicating changes clearly to the public. That work lands on local government staff.
Where GIS — and iGIS® — Fits In
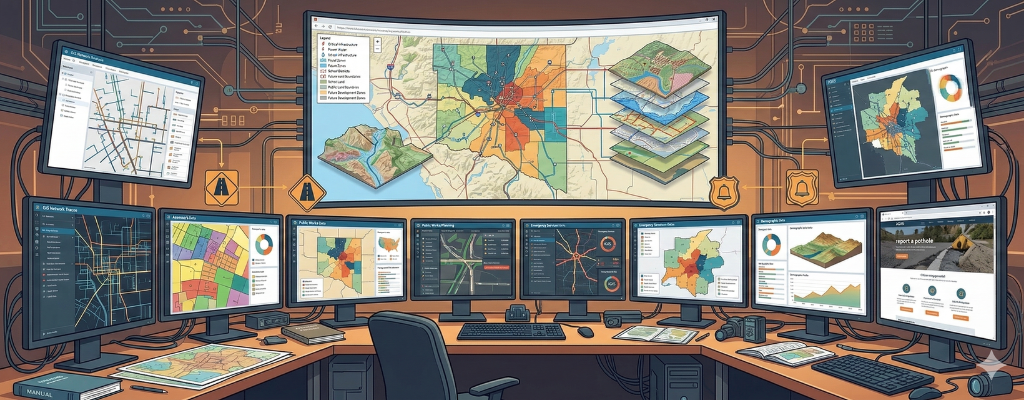
Redistricting is, at its core, a spatial problem. Boundaries shift, populations move, and the effects ripple through every layer of local government data. Interactive web GIS is the ideal technology for redistricting because the effects of boundary changes on associated populations can be tested interactively and worked on collaboratively.
For counties and localities navigating these changes, a platform like iGIS® gives staff the ability to layer census population data over existing district boundaries, visualize proposed changes, and communicate those changes to residents through an accessible, web-based interface. Instead of asking the public to parse dense legal boundary descriptions, an interactive map puts everyone on the same page — literally. It also keeps records clean. When boundaries shift, your GIS data needs to shift with them: precinct files, zoning layers, service districts, and administrative boundaries all need to stay current and consistent.
The value isn’t just in drawing the lines. It’s in managing everything that comes after.
What Counties Should Be Doing Now
Regardless of how Virginia’s April referendum resolves, local governments benefit from having their spatial data in order before redistricting decisions are finalized. That means maintaining accurate, authoritative parcel and boundary data, ensuring your GIS platform can ingest updated census geography, and having a way to communicate boundary changes to staff and residents without generating a support backlog. iGIS® is built for exactly that kind of ongoing, practical management — not just for one-time redistricting events, but for the data maintenance work that redistricting makes visible.
If your county is watching Virginia’s situation unfold and wondering whether your GIS infrastructure is ready for whatever comes next, that’s a conversation worth having sooner rather than later. Reach out to the InteractiveGIS team to talk through what a 90-day iGIS® demo looks like with your own data.
Your County Has One GIS Person. Here’s How to Make That Work.