Most people assume GIS is government territory — county parcels, utility lines, zoning maps. And they’re not wrong. iGIS® was built with local governments in mind, and that’s still very much our home base. But the platform is flexible enough that some organizations are using it in ways that might surprise you. Three of them have been working with us on applications that have nothing to do with tax assessments or road maintenance and everything to do with safety, growth, and community.
When a School Map Becomes a Lifeline
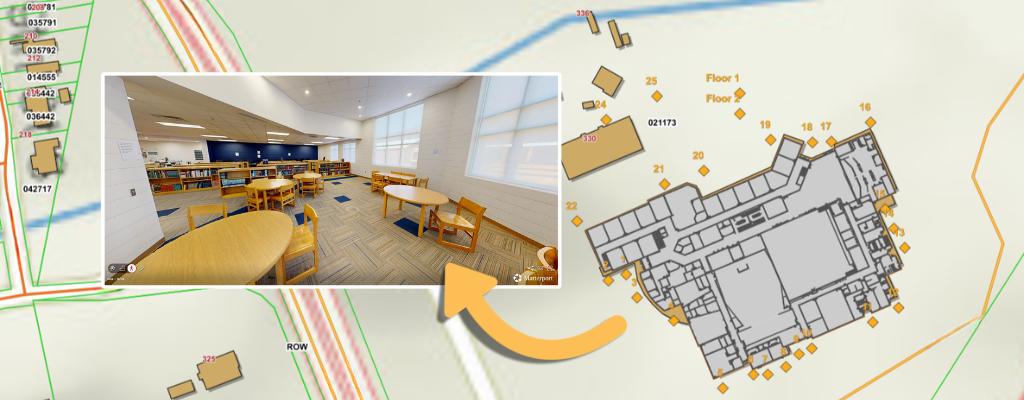
School safety funding is being spent differently than it was a decade ago. Beyond cameras and locked doors, some schools are now investing in 3D interior mapping — detailed virtual walkthroughs of every building on campus — so that first responders have eyes inside a structure before they ever set foot in it. Room names, door and window locations, stairwells, safety equipment: all of it, accessible in seconds.
In 2024, Education Week recorded 39 school shootings that resulted in injuries or deaths — the second-highest annual total since the publication began tracking incidents in 2018. EdWeek That number alone should make every school administrator think differently about what “preparedness” actually means. And yet, according to school safety experts and law enforcement, the floor plans schools rely on during emergencies are often outdated and unreliable, leaving first responders without quick access to shared information when they arrive on site. Esri
iGIS® addresses exactly that gap. A first responder or administrator clicks on a school building on the map and pulls up the interior model immediately — no special software, no login maze, no wasted seconds during a situation where every second counts. Research published in the International Journal of Science and Research Archive found that detailed indoor mapping significantly reduced detours, optimized access to critical zones, and improved response times for first responders compared to traditional external-only routing. Ijsra The map becomes a command tool.
Multiple states are now passing legislation requiring K-12 schools to update and digitize their campus maps and share them with local first responders. 911cellular We believe technology like this should be standard, and we’re proud that iGIS® can support it.
A Landscaping Company That Thinks Spatially
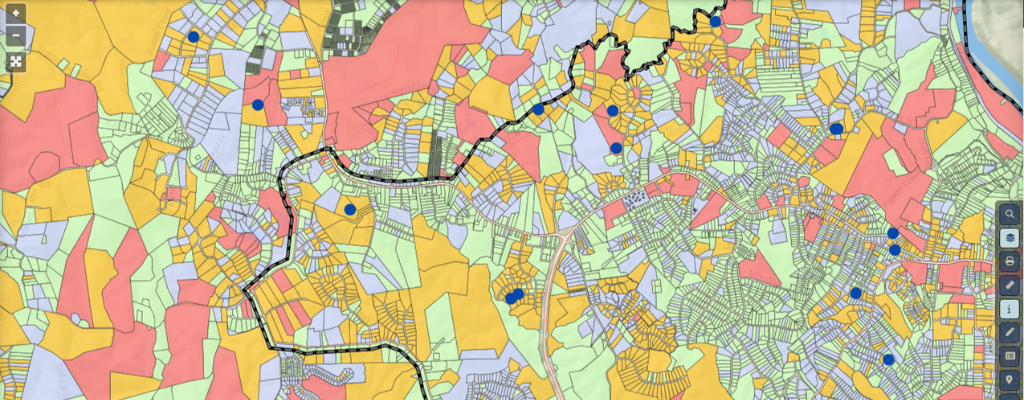
This one might feel like a left turn, but stay with us. A private landscaping company came to us looking for a smarter way to manage its business — and as it turns out, most of what they needed was geographic. They wanted to see their active clients on a map, identify nearby properties with high land value as prospecting targets, and build denser service routes so crews aren’t crisscrossing town unnecessarily.
This is a more pressing operational issue than it might sound. A company serving 50 properties clustered within a few neighborhoods will be far more profitable than one serving the same number of properties scattered across 30 miles, because dense service areas reduce drive time, lower fuel costs, and allow crews to complete more jobs per day. Growgroupinc In a U.S. landscaping services market valued at over $188 billion, IBISWorld that operational edge is the difference between a company that grows and one that grinds.
iGIS® gave this company a living map of their service area. Active clients are plotted and categorized. Prospect identification layers on land value data to surface logical targets near existing routes. Address clustering helps the team plan direct mail and door-to-door outreach in tight geographic windows rather than carpet-bombing a zip code. The result is a leaner operation that spends less time driving and more time billing. Geographic targeting is essential for profitability, and marketing efforts that build route density within defined service areas create operational efficiencies that directly impact the bottom line. Growgroupinc
It’s a good reminder that spatial thinking isn’t reserved for planners and engineers. Any business that moves people, resources, or services across a geography can benefit from seeing that geography clearly.
A Church That Mapped Its Mission
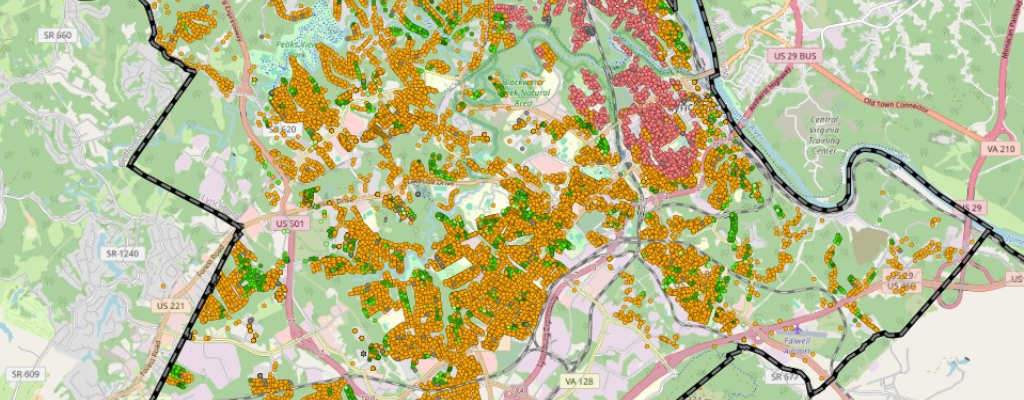
A church working to engage its city came to us with an outreach challenge that was fundamentally geographic. They had volunteers, they had neighborhoods, and they had no clear way to coordinate who was going where, what had been done, and where gaps remained.
Using iGIS®, the city was divided into defined outreach segments. Volunteers in the field pull up a simple form on their phones, log contact information as they go, and the map updates in near real time — segments shift color as coverage progresses, so leadership can see momentum building and redirect resources where engagement is falling behind. Custom dashboards give coordinators a live view of the effort without waiting for spreadsheet check-ins at the end of the week.
This kind of visibility matters more than people realize. Organizations that invest in real-time dashboards report measurable gains in engagement — one platform found that donor satisfaction scores improved by 42% when stakeholders could see live progress data tied directly to their contributions and efforts. Plotline For a volunteer-driven organization trying to move an entire city, that kind of transparency isn’t just motivating — it’s operationally essential. The platform didn’t change the mission. It just made the mission legible, visible in a way that keeps a large volunteer operation moving in the same direction.
What These Three Have in Common
None of these organizations are GIS professionals. None of them had a dedicated mapping department. What they had was a problem with a geographic dimension — and the willingness to try a tool that could surface it. iGIS® met them where they were, without requiring a technical overhaul or a six-month implementation.
Full case studies on each of these use cases are coming. If you want to be the first to read them — or if something in this post made you think about your own organization differently — stay tuned.