
From World Cup Heat Maps to a New National Datum: 5 GIS News Stories Worth Your Time This Fall

Fall tends to fill the inbox with headlines, and the GIS world has produced its share since summer. Some of the most interesting stories came from county offices and health departments, while others came from orbit or from the federal agencies that set the ground rules everyone else builds on. Here are 5 developments that stood out to us, each paired with a practical idea you can put to work.
1. LA County Traded Emailed PDFs for a Live Map During the World Cup
When Los Angeles hosted matches for the 2026 FIFA World Cup, the county’s Department of Public Health faced a crowd of historic size, with SoFi Stadium welcoming nearly 600,000 fans across 8 matches and hundreds of thousands more gathering at watch parties around the county. The department’s old way of building situation reports, which meant copying data into Word documents, converting them to PDFs, and emailing them out, had already struggled to keep pace during the January 2025 wildfires.
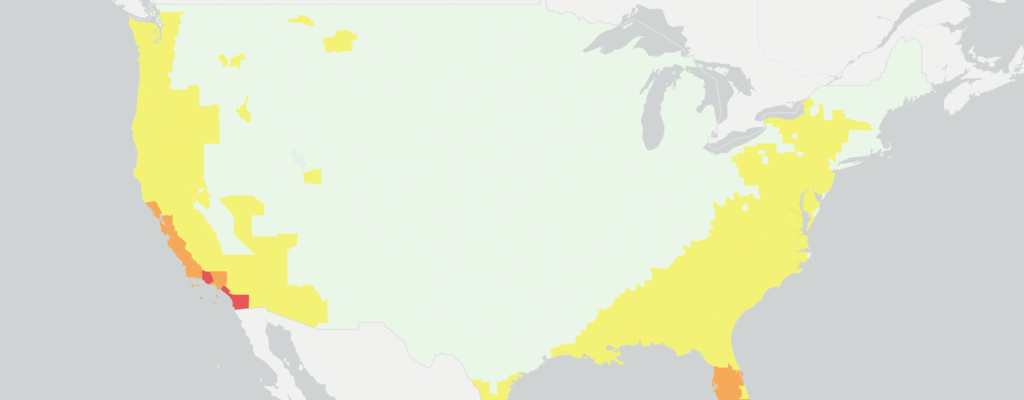
For the World Cup, the team built a GIS-powered situation report that pulled weather forecasts, heat risk, air quality, and disease surveillance into one continuously updated view, producing 17 reports between June 1 and July 17. Because LA County is full of microclimates where one city can bake while a beach town stays comfortable, staff used tools like the CDC’s HeatRisk map to read conditions venue by venue and send inspectors to confirm water supplies ahead of a hot opening weekend at the Coliseum. The same tool is now the foundation for planning the 2028 Olympic and Paralympic Games.
If your department still assembles reports by hand, start with the 1 or 2 data feeds you copy and paste most often, since weather is a common culprit, and build a live map around those before tackling anything bigger. Washington, D.C.’s Fire and EMS Department offers another example of real-time dashboards saving critical seconds on the public safety side.
2. A North Carolina County Turned Its Food Desert Map Into a Delivery Program
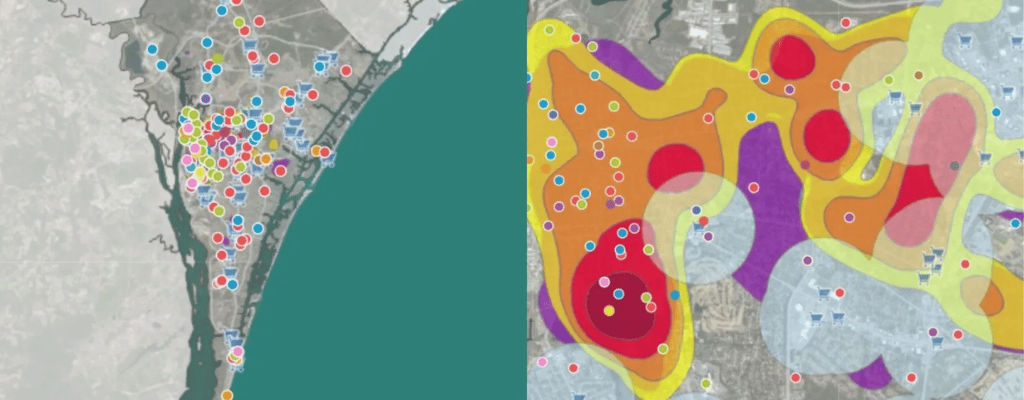
New Hanover County uses a food access mapping tool to pinpoint neighborhoods where residents live far from fresh groceries, and that work identified 8 food deserts across the county. This spring, the New Hanover Community Endowment awarded the county $1,244,215 for a 2-year grocery delivery program serving all 8, a shift in strategy after an earlier plan to build a grocery store in one of those areas fell apart. The resulting Food and Medication Delivery Program launched in August through a partnership with Instacart, giving eligible households in the mapped zones a free 12-month delivery membership for groceries and prescriptions, with a goal of enrolling 2,000 households in the first year and 3,000 by the end of the pilot. Residents can also find nearby food assistance sites through the county’s public Community Resource Portal.
The broader lesson is that a map earns its keep when it travels beyond the GIS office; here, the boundaries drawn on a map became the service area for a funded program. We’ve written more about using GIS to improve communication between departments if you’re looking for a place to start.

3. NISAR’s Radar Data Is Now Free for Everyone
NASA and the Indian Space Research Organisation launched the NISAR satellite in July 2025, and on July 20, 2026, its calibrated radar data opened to the public through NASA Earthdata and the Alaska Satellite Facility. Radar sees through clouds and works day or night, and NISAR scans nearly all of Earth’s land and ice twice every 12 days, which makes it well suited to tracking ground movement, flooding, crops, and forests on a regular schedule. Its 39-foot antenna reflector is the largest NASA has ever sent to space, and mission scientists marked the release with an image of an Antarctic mountaintop ringed by cracked ice that looks remarkably like a hummingbird. The full first-year science record is expected by the end of 2026. For a recent example of satellite data guiding a real response, see how satellite mapping supported Nepal’s flood recovery.
Most local governments won’t process raw radar files in-house, so the smarter move is to ask your state geological survey or a nearby university whether they plan to build subsidence, landslide, or flood products from NISAR that your team could use. Staff who want to build their own skills can explore the free remote sensing training we covered earlier this month.
4. The Nation’s Coordinate System Is Getting Its Biggest Update in Decades
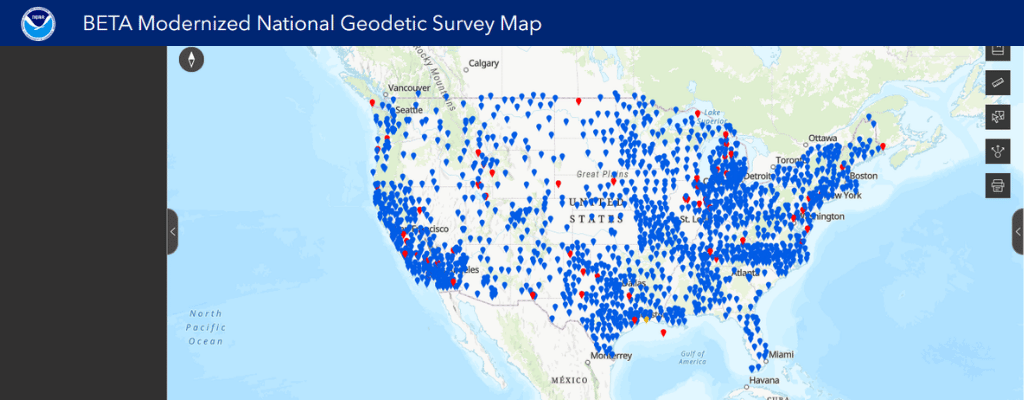
This fall, the National Geodetic Survey released beta tools for the modernized National Spatial Reference System, the framework that tells every map and survey in the country where “here” is. The new reference frames, led by NATRF2022 and NAPGD2022, will replace NAD 83 and NAVD 88 and rely on GPS-style satellite stations instead of physical benchmarks, accounting for the slow drift of the continent itself. A public testing period of at least 6 months is underway, with the official transition anticipated in 2027. Coordinates and elevations will shift once the change takes effect, and the amount varies by location.
A good first step is an inventory of which of your datasets reference NAD 83 or NAVD 88, followed by a conversation with your surveyor or engineering partners about timing. Small coordinate errors have a way of growing into big ones, as a few of our real GIS horror stories show, and utility records are especially vulnerable given the hidden cost of outdated utility maps. Anyone curious can explore the NGS beta tools now and send feedback, which NGS is actively requesting.
5. 2030 Census Prep Starts With Your Address Data
The 2030 Census may sound far off, but the Local Update of Census Addresses program, known as LUCA, gives local, state, and tribal governments a once-a-decade chance to review the address list the Census Bureau will use to count residents. Invitations go to each government’s highest elected official in May 2027, with the formal review running from October 2027 through March 2028. The review window has grown from 4 months in 2020 to up to 6 months this cycle, and governments can already download address count files to compare against their own records. The stakes are simple, since a household missing from the list is likely to be missed in the count.
Counties that want a head start can gather their address sources now, including building permits, E-911 address files, utility records, and assessment data, then compare local counts to Census block counts to spot areas with new development that may be underrepresented. The same address work also supports the nationwide NG911 transition, so one cleanup effort can pay off twice.
Where It All Points
Read together, these stories share a common thread. Whether the goal is keeping World Cup fans safe, getting groceries to the right neighborhoods, or making sure every household gets counted, the results depend on spatial data that is current, organized, and easy to share, which is the same foundation we explored in Is Your GIS Ready for AI? That’s the work iGIS® is built to support, and if any of these stories sparked an idea for your own organization, you can try iGIS® with a free demo or reach out to our team to talk it through.
Know someone who’d enjoy this roundup? Feel free to pass it along.
Sources
Baltazar, A. (2026, September 22). LA County puts public health on a map for the FIFA World Cup and LA28. Esri.
Baltazar, A. (2026, September 29). North Carolina food banks map food deserts to meet rising need. Esri.
Geo Week News. (2026, April 1). Don’t be scared of NSRS modernization, be prepared.
Jet Propulsion Laboratory. (2026, July 21). US-India satellite delivers data, reveals ‘hummingbird’ in Antarctica. NASA.
NASA Earthdata. (2026, July 21). NISAR L-band data now publicly available.
U.S. Census Bureau. (n.d.). 2030 Census Local Update of Census Addresses (LUCA).
Zilkoski, D. B. (2026, October 7). NGS reaches major milestone with NSRS modernization. GPS World.