
Making the Most of Land Cover and Conservation Layers in GIS
When you open a map and see patches of green forest, blue waterways, or clusters of gray urban development, you’re looking at more than just colors. Land cover layers show what’s really on the ground, and for local governments and GIS professionals, they’re a game-changer. They help answer everyday questions. Where is growth happening? How do we balance development with preservation? Which areas need the most attention after a storm? Understanding these layers isn’t just technical; it’s practical and connects directly to the decisions shaping our communities.
So, what exactly is a land cover layer?
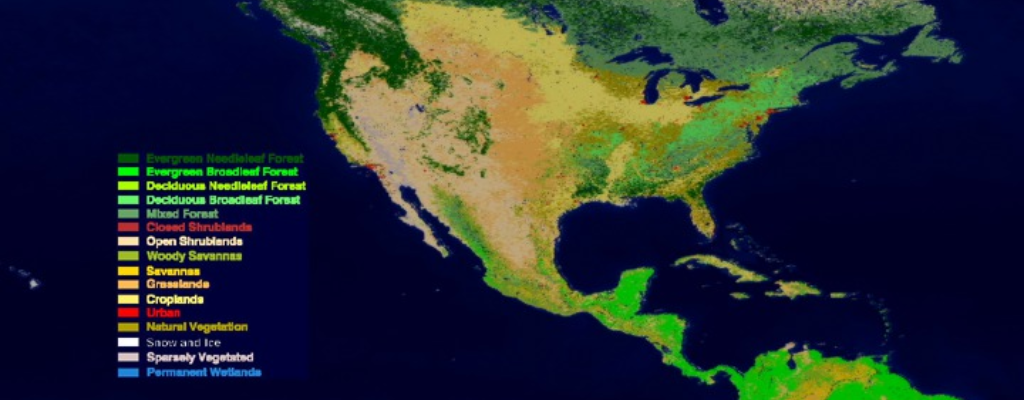
Land cover layers classify the Earth’s surface into categories like forest, pasture, wetlands, and urban areas. They’re built from satellite imagery and remote sensing data, then turned into color-coded maps that give you a snapshot of how land is being used.
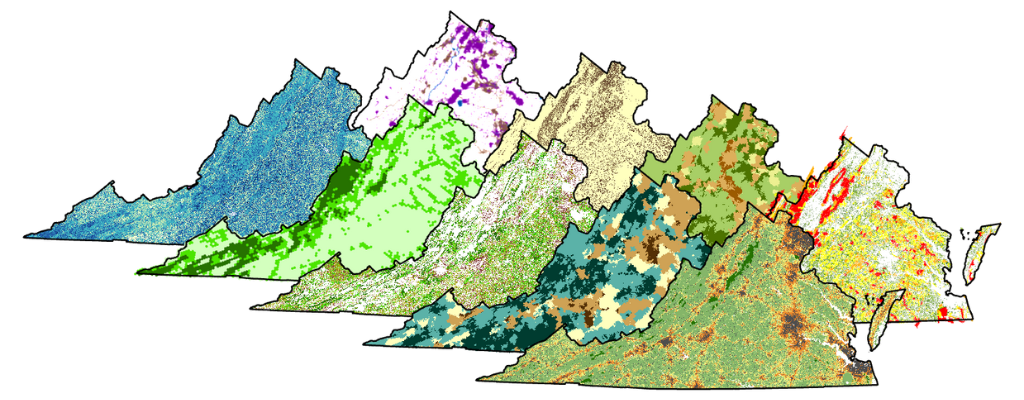
In the U.S., the National Land Cover Database (NLCD) is a widely used resource, providing 30-meter resolution data across the country. Some states, like Virginia, offer even more detailed options. The Virginia Geographic Information Network (VGIN) Land Cover dataset, for instance, uses 1-meter resolution data—making it far more precise for local planning.
These datasets are essential for spotting patterns like urban sprawl or forest fragmentation, but they also help tackle everyday needs: checking impervious surface coverage, planning stormwater projects, or identifying areas suited for future development.
Resolution matters more than you think
Not all land cover data is created equal. National datasets like NLCD are perfect for big-picture analysis, but at 30 meters per pixel, they can miss finer details. High-resolution state datasets, like Virginia’s 1-meter VGIN Land Cover, reveal a clearer view for local tasks such as urban tree canopy studies or impervious surface tracking.
For the best results, many GIS teams use both: national data for regional trends and high-resolution data for site-specific planning. Think of it like zooming in with a camera lens: you need the wide-angle view for context, but you also need to focus in sharply when it’s time to make a decision.
Adding conservation lands to the mix
Land cover is powerful on its own, but pairing it with conservation layers adds a new dimension. Conservation lands show protected spaces like parks, easements, wildlife habitats, and even tribal or federally managed holdings. These layers help planners understand where development is restricted and where preservation efforts are concentrated.
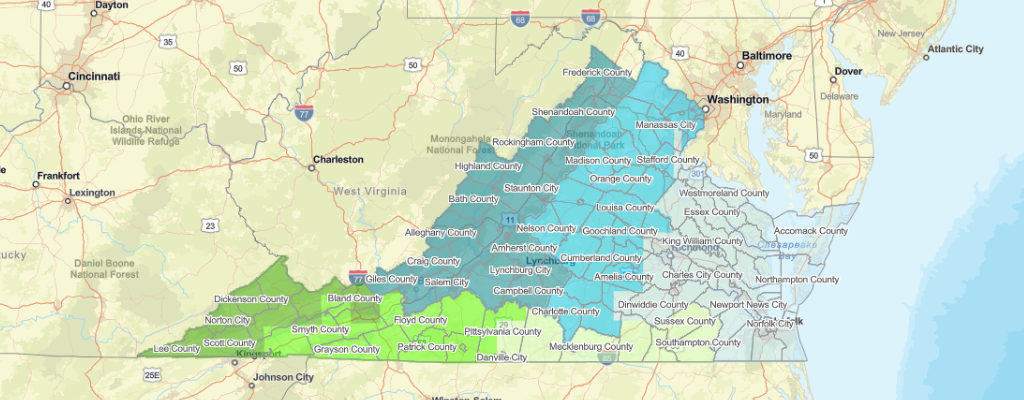
Virginia’s conservation data, for example, tracks everything from state park boundaries to private easements. This makes it possible to spot ecological corridors, understand overlapping land protections, and prioritize areas for future grants or conservation projects. For counties and municipalities, these layers aren’t just about environmental stewardship—they’re critical for zoning decisions, infrastructure planning, and maintaining compliance with state or federal guidelines.
How these layers work together in real life
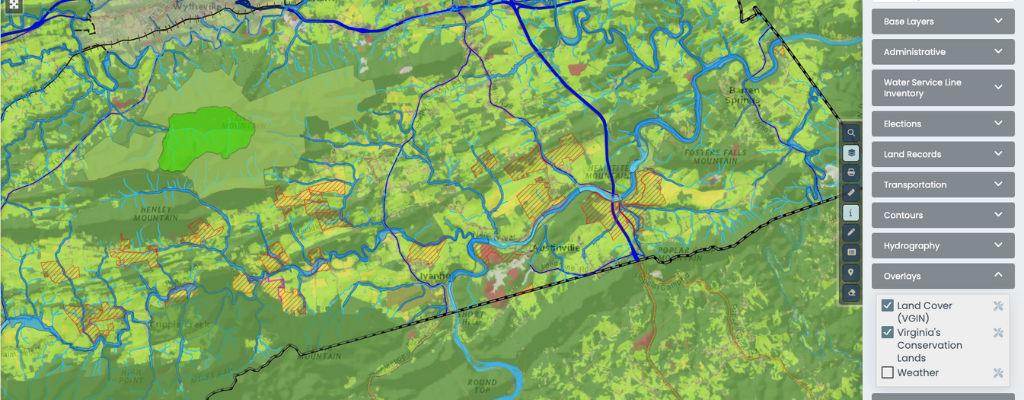
Picture this: A county planner is reviewing a proposal for a new housing development. They start by pulling up the land cover layer to see if the area is forested or already cleared. Next, they add conservation lands to check for protected easements or state holdings nearby. Hydro layers are important in this to spot streams and wetlands that might be affected. Finally, parcel boundaries to tie it all together.
With this layered view, it’s clear whether the project aligns with existing regulations, poses a risk to sensitive areas, or could create downstream runoff problems. Instead of relying on separate reports, all of this information is right there in one GIS view—easy to see, easy to share, and ready for informed decisions.
A practical solution
Land cover and conservation layers aren’t just GIS jargon—they’re practical tools that help governments connect data to real-world outcomes. By using them together, local staff can see where their communities stand today and plan for the future with clarity and confidence.
InteractiveGIS makes working with these layers simple and effective, so planners and staff can spend less time toggling between datasets and more time making smart, well-informed decisions. Schedule a demo with your data for FREE today, and see how your community’s land cover and conservation data can come alive.