Thanksgiving week turns the entire country into one big migration map. Highways fill before sunrise. Airport terminals become their own ecosystems. Backroads that haven’t seen serious action since June suddenly carry determined drivers who swear they’ve found a smarter route to Grandma’s house. It’s an annual ritual that somehow feels both chaotic and predictable.
Underneath all that movement sits something you don’t usually associate with turkey and mashed potatoes. GIS quietly helps agencies understand the patterns behind holiday travel and smooth out the rough edges long before anyone loads up a plate.
Think of this as a behind-the-scenes tour of how mapping helps the country get to Thanksgiving dinner on time.
How agencies predict the crunch
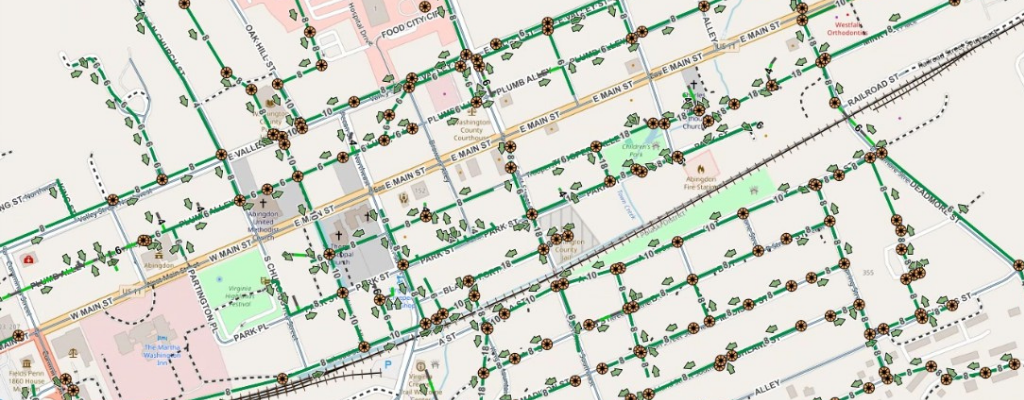
Thanksgiving traffic isn’t random. The same corridors clog up every year, the same exits slow to a crawl, and the same regions see their population double as visitors come home. Departments of Transportation lean on GIS to study those patterns and make better decisions.
Historic traffic layers show where backups form. Crash data highlights high risk segments. Travel models help agencies plan how much volume a road can realistically handle. When crews know that tens of thousands of drivers will funnel through the same few choke points, they can time signals, adjust work zones, and plan staffing in ways that keep people moving.
A simple example is a DOT pausing nonessential construction on key corridors because GIS models show how badly delays would compound over the holiday weekend. Those small adjustments add up for the families trying to make it from one side of the state to the other before the rolls come out of the oven.
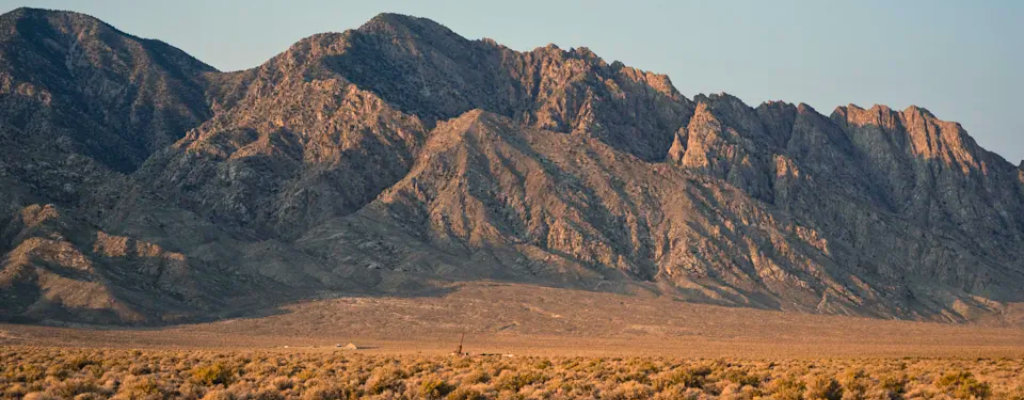
Weather adds its own twists
Late November weather doesn’t always cooperate. Rain, snow, sleet, or an early cold snap can turn an already busy travel day into something more complicated. GIS helps agencies track incoming storms and understand how they’ll affect specific road segments.
Crews rely on map layers that combine radar, pavement sensors, temperature data, and wind forecasts. It helps them figure out where they need to pretreat roads, where icing is most likely, and how to stage trucks so they can respond quickly. If a storm is expected to hit mountain corridors at the same time peak travel begins, GIS shines a spotlight on those high risk zones. The public never sees that preparation but they feel the benefit when roads are safer than expected.
Public safety teams use GIS too
Thanksgiving weekend stretches emergency services. More cars on the road means more incidents to manage. GIS helps public safety agencies position their resources where they’re most likely to be needed.
Dispatch centers view real time traffic feeds to understand congestion. Police departments use mapping tools to place patrol units strategically. EMS teams track call patterns and adjust coverage so no area is left exposed. When you zoom out, the whole system functions like a coordinated grid built from spatial decisions. Drivers only notice when help arrives quickly, not the planning that made it possible.
Small towns feel the impact too
It’s not just big highways feeling the pressure. Local governments see their own travel spikes. Holiday parades reroute traffic. Shopping districts become saturated. Overflow parking lots fill faster than expected. Even parks and trailheads see more activity as families look for something to do between meals.
Cities and counties use GIS to map closures, update detours, place signage, and monitor impacts. A simple web map showing where visitors can park for a tree lighting event can take hours of confusion off the table. These little touches go a long way when thousands of people are moving through an area they only visit once or twice a year.
Everyone becomes a navigator this time of year
The human side of travel is what makes Thanksgiving so memorable. Someone in every family insists they know a shortcut. Someone else trusts their favorite app. Another person claims the backroads are always faster. The group inevitably debates it while stuck behind the same line of brake lights.
Those small arguments echo the larger work agencies do with spatial data. People are trying to navigate patterns they feel, while agencies are mapping the real patterns that drive those experiences. GIS just does it with more accuracy and fewer heated discussions about whether Exit 118 is really the better option.
Why any of this matters for your community
Thanksgiving weekend is a small snapshot of something that happens all year. People move. Seasons shift. Infrastructure gets pushed harder than usual. GIS helps communities understand these peaks and valleys so they can plan smarter, communicate better, and avoid surprises.
When a local government has even a few well structured map layers, they can start predicting their own “holiday migrations.” Maybe it’s a football weekend, a downtown festival, or a seasonal tourism rush. Understanding traffic flows, parking pressure, pedestrian movement, and weather risks can turn those events from stressful to smooth.
A final note of gratitude
As we all head out for turkey, family time, or a well earned long weekend, it’s worth appreciating how much smoother travel has become. No more flipping paper maps in the passenger seat. No more printing MapQuest directions and hoping you stapled them in the right order. Today we get live traffic patterns, hazard alerts, smarter routes, and real time insight that only exists because GIS quietly powers the digital tools we depend on. A little gratitude for the tech that keeps us moving feels right this time of year. Happy Thanksgiving!